Clustering with K-Means
K-Means is a classic machine learning algorithm for discovering clusters within data sets. It is a form of unsupervised learning, where the algorithm is not privy to the structure of the data, but is in fact trying to learn said structure. My last blog post, concerning linear regression, was an example of supervised learning, where the algorithm attempts to predict values and with a clear right or wrong answer. Here, we will examine the K-Means algorithm that identifies data points that have grouped together, or clustered, within the data set.
Clustering occurs frequently in natural data, and discovering these groupings can be very advantageous to a data scientist. Although searching for clusters is typically an unsupervised task, their existence permits us to seek new information about the data set and attempt to make predictions about novel data. This kind of application is commonly employed by companies seeking to recommend new products or services for their customers. If Netflix knows that people who love movie A also love movie B, then they will likely suggest movie B to you after you view movie A.
The Setup
We will begin with the following scenario: imagine that we collected a survey from a number of participants, asking them to rate their preference of Cola C and Cola P. If we plot these ratings on a two-dimensional coordinate plane, the results might look something like this:
It is clear that the results have clustered around certain areas of the graph. Some people mostly prefer Cola C, others just Cola P, and some do not particularly care for either.
Our goal will be to identify these groups mathematically. We will do this by assuming that each cluster has some “center” point that the data points in that cluster gather around. The K-Means algorithm will give us a way to identify where these centers are for each of the clusters in our data set.
Note that estimating these centers is inherently an unsupervised task. We do not know where the centers are in the data, we want the algorithm to discover them. A supervised task would involve trying to match data to a known structure. Here, we are trying to learn the structure of the data itself.
The Algorithm
The K-Means algorithm is relatively straightforward and simple mathematically. Unlike gradient descent, no partial derivatives are necessary; just basic addition and division.
We begin by assuming there are a specific number of clusters in the data set: \(k\). This hyperparameter may need to be tuned if the data is opaque, but in our case a value of 3 is obviously correct.
Each of these assumed clusters must have a center, as discussed earlier. We can initialize these cluster centers randomly. Although incorrect at the outset, their correct positions will be learned as the algorithm progresses.
The algorithm will then proceed as an iteration over two sequential phases, referred to here as assign and adjust.
The assign phase will iterate over ever data point, calculate its distance from each of the current cluster centers, and “assign” itself to the center it is closest to. Here, distance can be measured a number of way (the example below will use the common Euclidean distance). The result will be that every data point will become associated with the cluster center that it best belongs with.
The next phase, adjust, will recalculate the cluster center positions based on which data points were assigned to it in the previous phase. Specifically, the new center position will be the average position of its assigned data points. This average, or “mean”, is where the algorithm receives its name, K-Means, since each of the K clusters will be centered around their average positions.
As these two phases are repeated, the cluster centers will eventually settle in their right position. That is because cluster centers will consistently move towards the data points closest to them, thus making them even closer. Eventually, the centers will no longer move, when they are in their final position, at which point the algorithm can stop.
So long as the number of cluster centers (\(k\)) matches the number of clusters in the actual data, the algorithm will converge fairly quickly. It should be noted, however, that it is possible for the cluster centers to settle in incorrect positions, even when the value of \(k\) is correct. This can occur if clusters are located close to one another, or when the initial values of the cluster centers are initialized poorly. To prevent poor initialization, it is common to run the algorithm multiple times, and compare the results from each execution for consistency.
The Code
For this example, we will use the same data set depicted from our Cola C vs.
Cola P survey. We will assume that these data points come as lists, X and
Y, corresponding to the \(x\) and \(y\) values, respectively.
The adjust phase of the algorithm is implemented below. It takes, the X and
Y values as parameters, as well as a list of the locations of the centers
(each center is a pair, i.e. centers[0] might be (22, 19)). The function
will return a list, nearests, which will contain a list of the assigned
data points for each center.
def assign(X, Y, centers):
    nearests = [list() for c in centers]
    for (x, y) in zip(X, Y):
        dists = [math.sqrt((x - cx) ** 2 + (y - cy) ** 2)
                 for (cx, cy) in centers]
        index = dists.index(min(dists))
        nearests[index].append((x, y))
    return nearests
The next function, adjust, take a cluster center position and a list of
positions assigned to that center, and return the new position for the cluster
center. It calculates the new position as the average \(x\) and \(y\) values
of the assigned positions.
def adjust(center, neighbors):
    if len(neighbors) == 0: # Avoid dividing by zero
        return center
    avg_x = sum([n[0] for n in neighbors]) / len(neighbors)
    avg_y = sum([n[1] for n in neighbors]) / len(neighbors)
    return (avg_x, avg_y)
The main function, which will serve as the program’s entry point, will
initialize the cluster center positions, and iterate over the assign and
adjust functions until the cluster centers no longer move by any significant
amount (the value of EPSILON) in any direction.
def main():
# ...omitting data collection...
# Initial center points randomly
centers = [(randint(0, 100), randint(0, 100)) for i in range(3)]
iterations = 0
while True:
# Move each center to the mean position of its assigned points
neighbors = assign(X_train, Y_train, centers)
new_centers = [adjust(c, n) for c, n in zip(centers, neighbors)]
# Stop if we've converged
if all([abs(n[0] - c[0]) < EPSILON and abs(n[1] - c[1]) < EPSILON
for (n, c) in zip(centers, new_centers)]):
break
else:
centers = new_centers
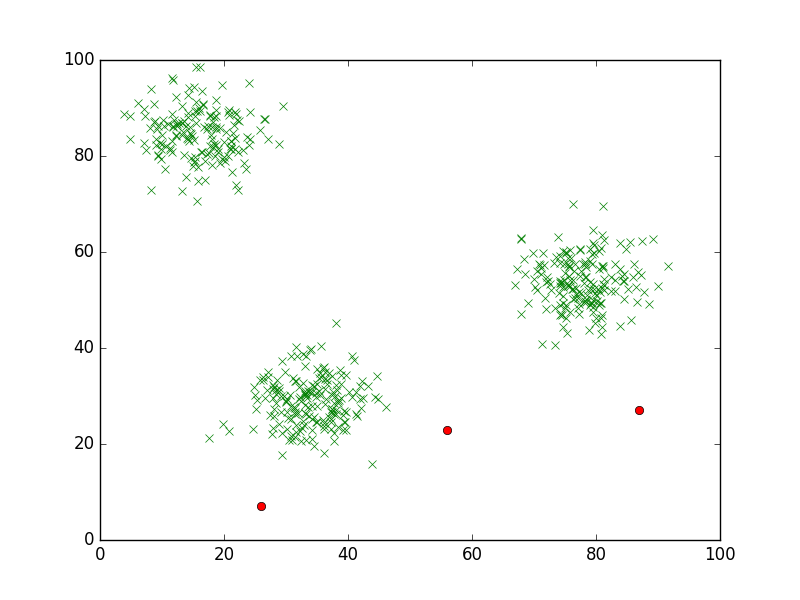
iterations += 1The following graphs display the algorithm in action. Initially, the cluster centers are placed at random on the graph.
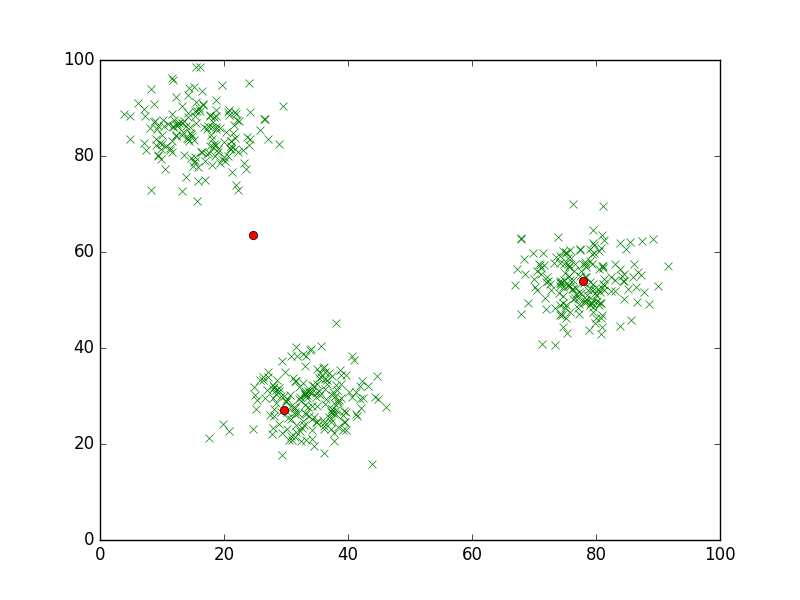
After the first iteration
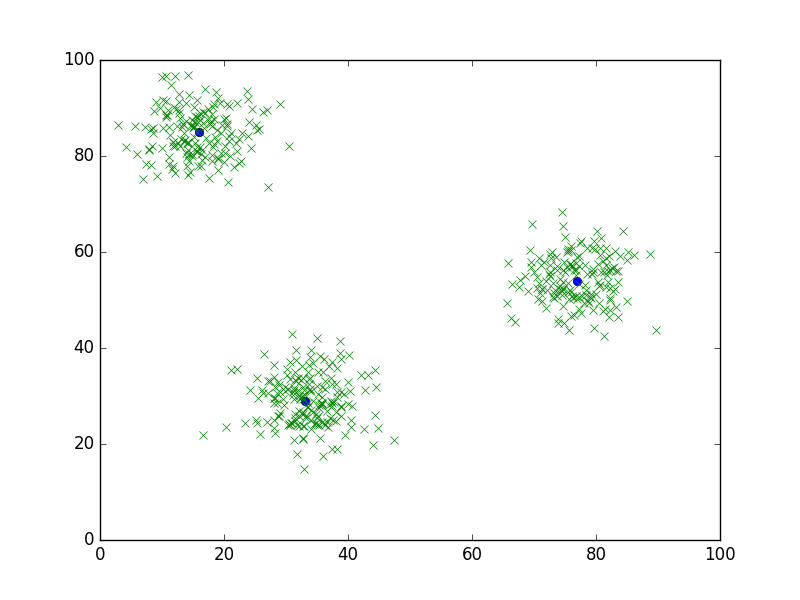
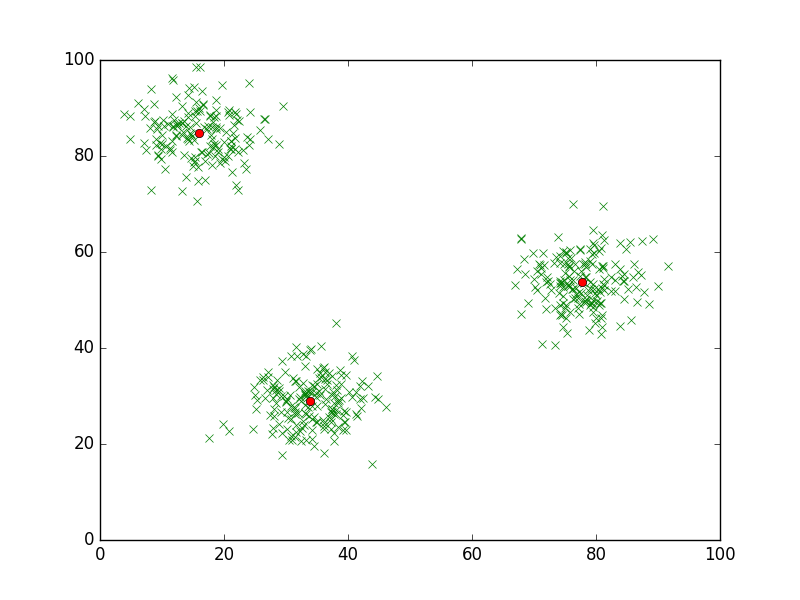
And after the second iteration, the cluster centers will settle, or converge on their correct positions.
Conclusion
K-Means is an extremely useful algorithm for discovering correlations within a data set. Even better, the algorithm is efficient and simple to implement (though much better implementations exist in open source machine learning libraries).